
Saying that a company has “a lot of debt” is not enough to establish that it is overindebted. A business with 10 million in debt may be perfectly sustainable if it generates strong, stable cash flows; another with 500,000 euros of debt may struggle if margins are low, maturities are concentrated and liquidity is insufficient. Debt must therefore be measured against the company's ability to support it. The useful question is not “how much debt is there?” but “how much debt can this business sustain without jeopardising investments, payments and continuity?” Answering requires at least three dimensions: debt level, borrowing cost and cash-generating capacity.

Financial debt and total liabilities are not the same thing
A company's liabilities include amounts owed to banks, bondholders, suppliers, tax authorities, social security institutions and others. Discussions of financial leverage, however, often focus on financial debt because it is directly linked to raising capital and paying interest. This does not make trade payables irrelevant. An unusual rise in supplier balances may signal financial strain, especially if it results from delayed payments. Distinguishing categories while retaining an overall view is therefore useful.
Net financial debt
One of the first indicators I would examine is net financial debt (posizione finanziaria netta, PFN), the difference between financial debt and liquid or similar financial assets under the definition adopted. In greatly simplified form:
If a company has 3 million in financial debt but also 2 million in cash, its net exposure differs greatly from that of a business with the same 3 million in debt and only 100,000 euros in cash.
Debt relative to EBITDA
A widely used ratio is PFN/EBITDA. If the business has net financial debt of 4 million and EBITDA of 1 million, the ratio is 4x. Intuitively, net debt equals four times annual gross operating earnings, although this should not be interpreted as the actual number of years needed for repayment because EBITDA and cash are not equivalent. The same ratio may be acceptable in a stable sector with limited investment requirements and much riskier in a cyclical business or one requiring substantial capital. There is therefore no universal threshold for every company.
Industry comparisons require caution
Normal debt levels vary between commerce, manufacturing, property and services. A business with property and long-term contracts can support a different structure from a cyclical company with few tangible assets. I would therefore use industry comparisons as a reference, not automatic approval. Sustainability always depends on the specific cash flows, margin volatility and quality of the assets financed. I would complete the analysis by checking how much cash is genuinely unrestricted. Restricted balances, advances received or liquidity needed for operations cannot be subtracted from debt with the same confidence as freely available money. Net financial debt therefore also requires understanding component quality, rather than simply applying a formula.
The relationship with equity
Another indicator is financial debt relative to equity. A company with 2 million in financial debt and 4 million in equity has a different structure from one with 2 million in debt and 200,000 euros in equity. The second has much higher leverage: shareholders provide a small share of resources and lenders a much larger share. Losses can quickly erode limited equity. Mechanical rules should be avoided here too. Different sectors use different financing structures, and book equity may not fully reflect assets’ economic value. The ratio is a signal, not a verdict.
The real question: is interest affordable?
A company may have substantial debt on very favourable terms. Another may have less debt but pay very high rates. I would therefore examine its ability to cover finance costs with operating earnings. Suppose a business generates EBIT of 600,000 euros and pays 100,000 euros in interest: coverage is 6 times. If interest rises to 350,000 euros, coverage becomes much more fragile. A fall in margins could quickly undermine debt-servicing capacity.
Operating cash matters more than profit
A business may report profit of 500,000 euros yet have little money available for instalments if that profit is absorbed by trade receivables, inventory or investment. To assess debt, I would therefore also examine operating cash flow and free cash flow. If the business generates cash consistently, debt can be serviced. If the company must continually obtain new financing to pay interest and principal on previous loans, the structure becomes fragile even with positive accounting profit.
Maturities: timing matters
Two companies with 5 million in debt can have completely different risks if the first must repay 500,000 a year for ten years and the second must repay 4 million in the next twelve months. This is why I would always read the debt maturity schedule. Risk depends not only on debt size but on when it must be repaid and the ability to refinance it. Refinancing risk becomes particularly significant when many maturities cluster in a period of high interest rates or tighter credit access.
The type of debt changes the risk
Two million financed with a ten-year fixed-rate mortgage loan has a different profile from two million permanently drawn under revocable credit facilities. In the first case, maturities and costs are predictable; in the second, the company depends on credit renewal and may face rapid changes. I would therefore examine average maturity, the variable-rate share, collateral, concentration by bank and amounts requiring refinancing within the next twelve months. I would also consider purpose: debt funding a productive investment with matching cash flows may be sustainable, while short-term credit covering recurring losses signals a structural problem. “Too much debt” is not defined by a universal number, but by the interaction of amount, cost, maturities and future cash-generating capacity.
Good debt and bad debt?
Distinguishing debt's purpose is useful, but I would avoid overly simple labels. Borrowing to buy productive plant generating margins can make economic sense; borrowing to cover structural losses is far more dangerous. Yet even a productive investment can turn out badly, and temporary working capital financing can be normal. The question is therefore: does borrowed capital generate sufficient returns to cover its cost and repay it? If the operating return on investment is consistently below borrowing costs, leverage destroys rather than creates value.
The signs that would worry me
Rather than a single threshold, I would look for a combination of signals: net financial debt rising faster than EBITDA, increasing finance costs, weak operating cash flows, almost fully used credit facilities, concentrated maturities, declining equity and continuous refinancing dependence. If several of these indicators deteriorate together, the issue is no longer “how much debt does the company have?” but its declining ability to manage it.
A complete example
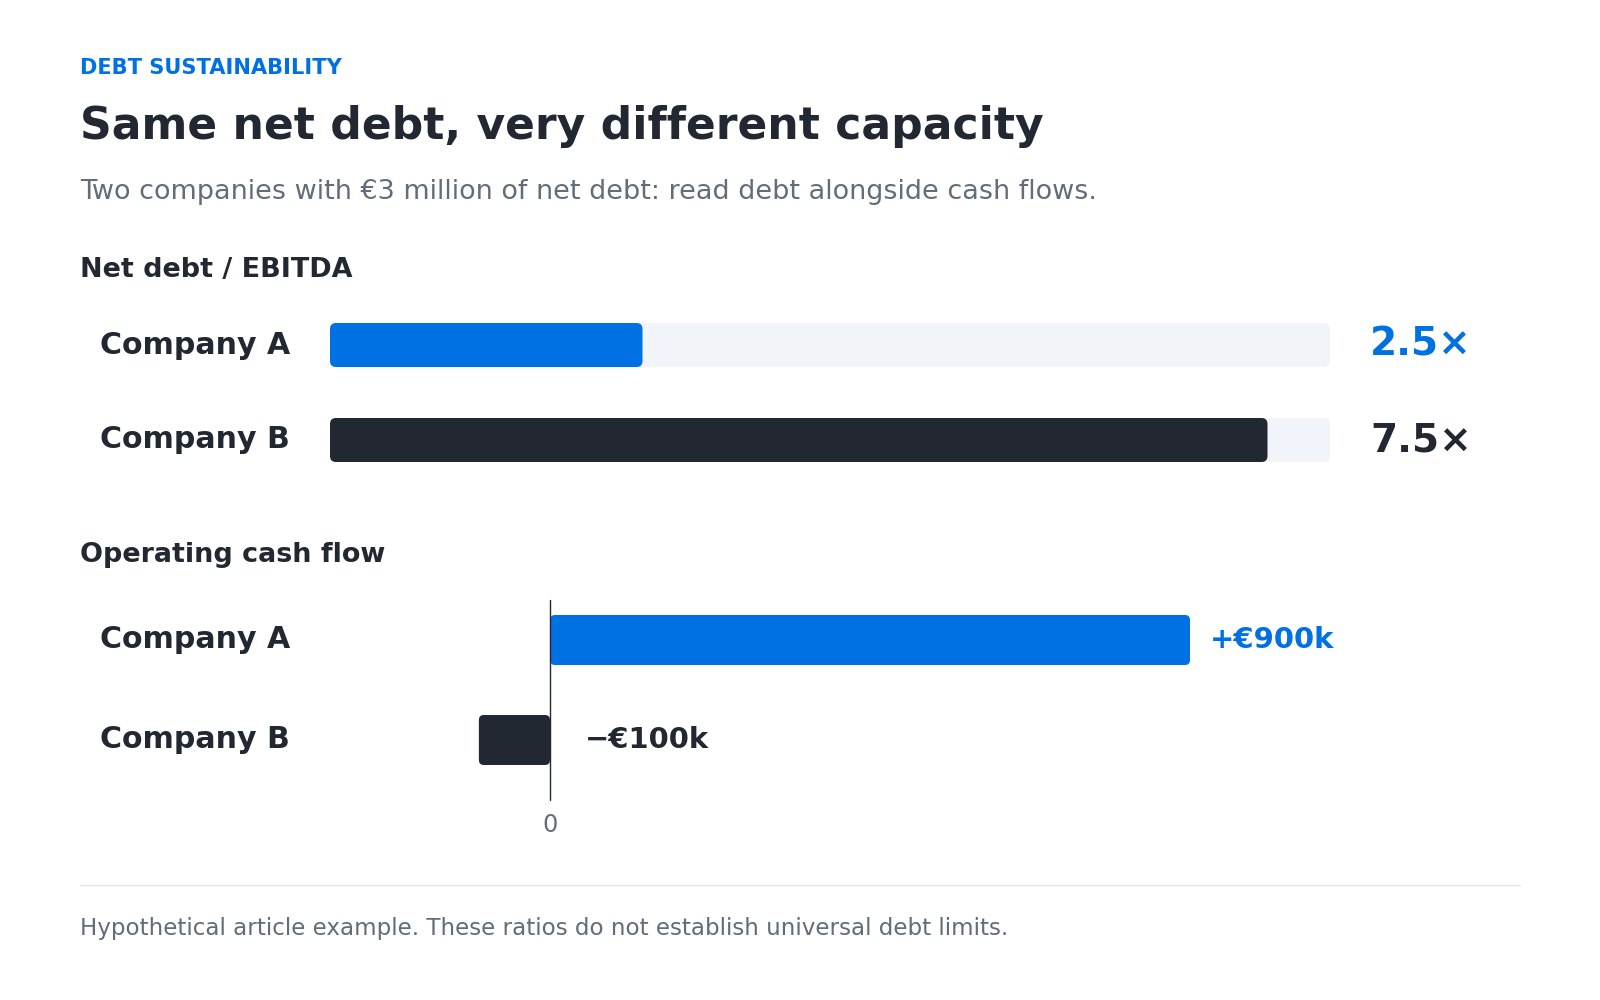
Imagine two companies with net financial debt of 3 million.
| Company A | Company B | |
|---|---|---|
| PFN | 3,000,000 € | 3,000,000 € |
| EBITDA | 1,200,000 € | 400,000 € |
| PFN/EBITDA | 2,5x | 7,5x |
| Finance costs | 120,000 € | 250,000 € |
| Operating cash flow | +900,000 € | −100,000 € |
| Equity | 5,000,000 € | 600,000 € |
The debt amount is identical, but the second company appears far more vulnerable: lower margins, higher leverage, heavier interest and negative operating cash flow. This is the central point: debt should not be judged in absolute euros, but relative to the business's economic and financial capacity. A company has too much debt when it significantly reduces its ability to absorb shocks, invest and meet maturities without continually relying on new financing.
Scenario analysis rather than rigid thresholds
To understand sustainable debt levels, I would build at least a normal and an adverse scenario. If EBITDA falls by 20%, rates increase and customers pay more slowly, can the business still meet its obligations? A structure that appears balanced only with continuously growing revenue is more fragile than one retaining room during a slowdown. Suppose net debt is 2.4 million and EBITDA 800,000 euros: the ratio is 3 times. If EBITDA falls to 500,000, the multiple rises to 4.8 without any change in debt. The same nominal amount becomes heavier because the operating capacity supporting it has declined. This is why bank covenants and credit analyses often examine dynamic ratios rather than debt in isolation.
Note. This article is for information and education only and does not constitute financial, banking or business advice.